First impressions are critical, and this is especially TRUE for your website.
A slow website or a web page can leave a lasting negative impression, and visitors can form an opinion about your brand within few milliseconds. One of the studies on user behavior says that just in 50 milliseconds (0.05 sec) visitors will decide whether to stay or leave your website.
A Fast Website = A Positive First Impression!
According to a study by Google’s own Search Quality Ratings Team, a one-second delay in mobile load time can lead to a 70% increase in abandonment rate. This research clearly explains the need to optimize for initial load time, speed and responsiveness of a website (different aspects of user experience).
To achieve user experience to its fullest, in June 2021, Google announced CORE WEB VITALS (CWV) – Largest Contentful Paint (LCP), First Input Delay (FID) now replaced with Interaction to Next Paint (INP) and Cumulative Layout Shift (CLS) as a new page experience signal to its already existing list of search signals responsible for page experience, and started using these factors as a part of ranking systems.
Although, all of the three metrics plays an equal role in achieving a good user experience, LCP and INP are often considered the most crucial signals in creating First Impressions. But, in order to pass the Core Web Vitals Assessment Test, the score should be “GOOD” for all three Core Web Vitals, based on real-user data (field data) across different devices.
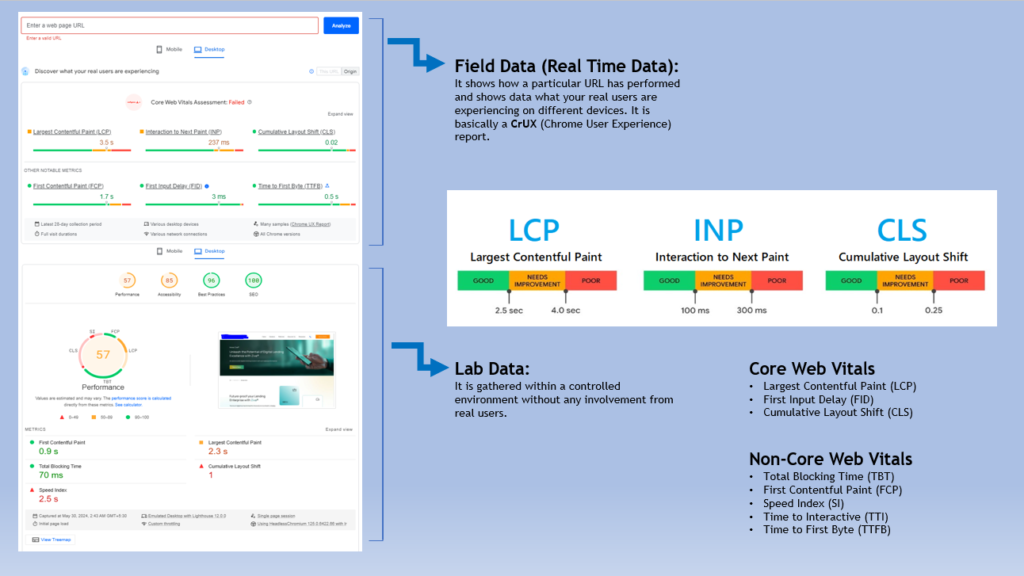
Field & Lab Data shown from Page Speed Insights Tool, Ideal scores of CWVs to Pass a Test
Note: If there is no Field data or real data available this likely means the website doesn’t get much traffic.
A Quick Glance on the Metrics LCP and INP
Largest Contentful Paint (LCP): LCP is an important performance metric that measures the time it takes for the largest piece of a content within the viewport i.e. (above the fold) to load on your screen and become visible. This content can be images, videos, text blocks, etc.
In simpler terms, LCP tells you how quickly the main content that users see on your webpage becomes visible. It essentially reflects the perceived loading speed of your website.
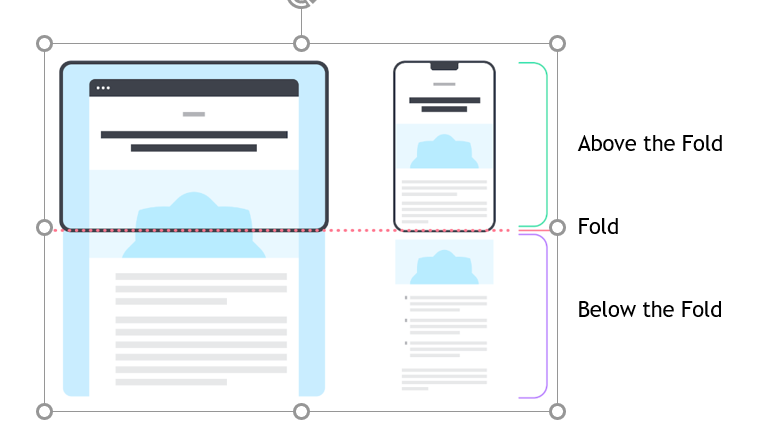
Interaction to Next Paint (INP): INP is a performance metric that measures the time it takes for your website to respond to user interactions within the initial viewport (above the fold). This responsiveness can include actions like clicking buttons, typing in forms, or scrolling.
INP reflects how quickly your website reacts to user actions, specifically those happening with the content users see first, without scrolling.
How to Measure LCP and INP?
There are multiple ways to know the LCP and INP of your page. The easiest ways to measure them are PageSpeed Insights (PSI), Lighthouse (Chrome Developer Tool), Search Console (Core Web Vitals Report), and the Chrome User Experience Report.
Here, in this article we are showing the usage of PageSpeed Insights Tool. The availability of LCP and INP in the field and lab data on PSI Tool are as follows:

A Case Study: Improving LCP and INP of a Web Page Using Our Industry Best Practices
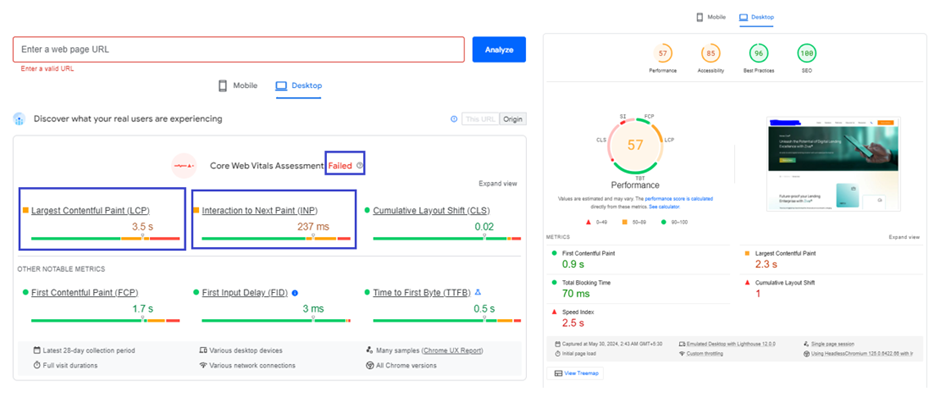
When I checked my Page Speed Insights report, the web page (for desktop view) had failed for the Core Web Vital Assessment based on field data from real users, as LCP and INP scores were not good. The tool then provided lab/Lighthouse data.
Real-Time/CrUX & Lighthouse Data of a Web Page from PageSpeed Insights Tool
Now, let’s break down some of the best practices to optimize LCP and INP individually based on our experiences.
When we have a CrUX data, we always concentrate on the real user data first. Because, even though the lab data gives good amount of information on the metrics and how to improve them, it might not be representing what your actual users are experiencing.
Optimizing Largest Contentful Paint (LCP)
To understand LCP of real users, I looked at field data section labelled as Discover what your real users are experiencing. The LCP score was more than 2.5 sec.
When Lighthouse and CrUX data doesn’t match, then CrUX provides a more accurate data of user experience. When both Lighthouse and CrUX or when just CrUX show the values that need improvement, the Lighthouse section can provide valuable insights on improving the metrics.
The lighthouse section (Lab data) showed an Audit report relevant to LCP which provided me some opportunities to improve LCP.
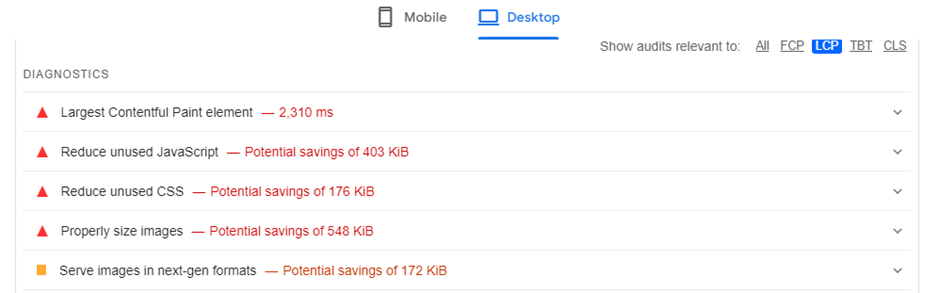
Lighthouse Diagnostics and Suggestions for Improving LCP
Before we move into the optimization process, I would like you to have a look on how LCP element is divided into four different load metrics, and how these phases are shown from PSI Tool respectively:
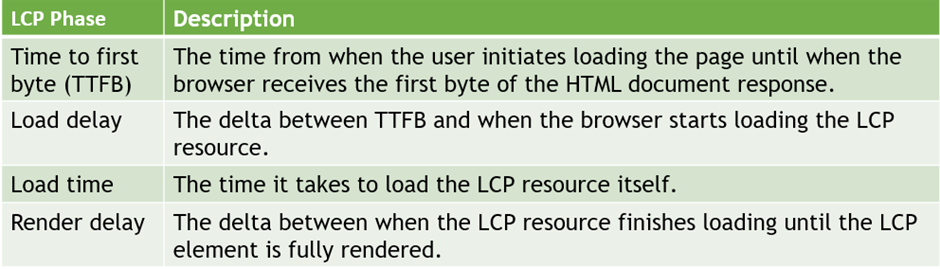
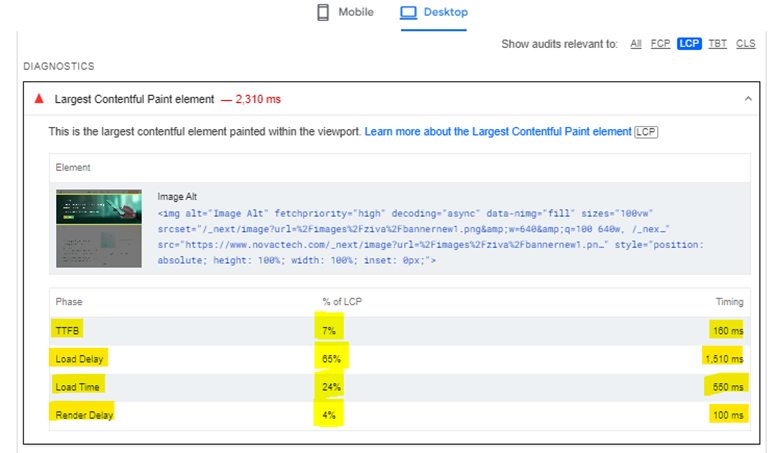
Well, now the image above helped me to understand the percentages and timing of each element for our webpage. Here, the idea is to reduce these times & percentages as close to zero as possible. By considering and fixing the recommendations given by the lighthouse, we were able to reduce the percentages and their corresponding timings.
Let’s see how we reduced each element…
1. Reducing Render-Blocking Resources
Lighthouse Showing the Render-blocking Resources
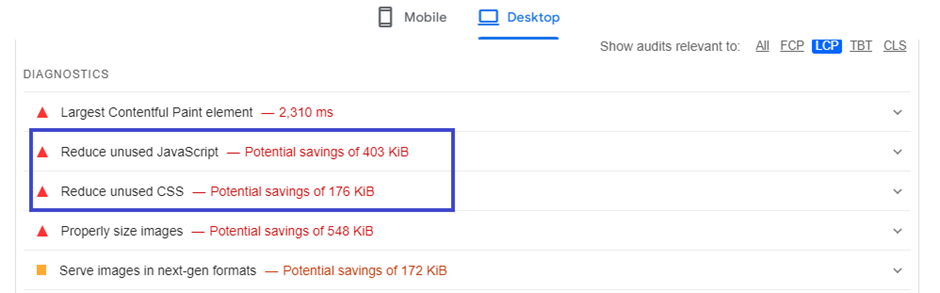
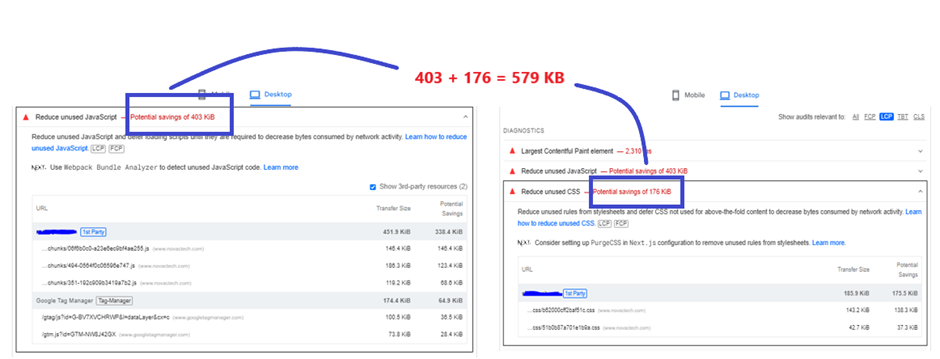
Reduce Unused JavaScript (JS) and CSS: According to our PSI tool, unused CSS and JavaScript are the render-blocking resources. This means that some of the CSS and JavaScript codes which are not actually necessary are still loading even after the LCP element has loaded.
Potential savings of Reducing Render-Blocking Resources
So, we checked and removed unwanted code manually, and using tools wherever necessary. You can see from the above image that we could achieve potential savings of total 579 KB.
Note: Scripts that are defined under above the fold content or LCP element are called as critical critical CSS and critical JavaScript respectively.
Others Methods to Optimize Render-Blocking Resources
Inline Critical CSS and JavaScript: To load these scripts as quickly as possible, one of things you can try is implementing inline critical CSS and JavaScript into the HTML. This means it has no decency on the external scripts and hence the page will quickly render and LCP goes down.
When the scripts are large, then use these methods:
Defer or async non-critical CSS and JavaScript: Both defer and async have different implications for how the browser handles them.
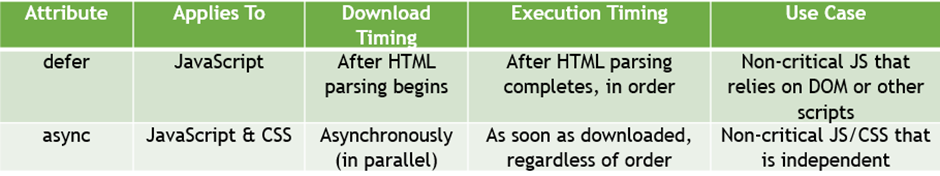
<script defer type="text/javascript" src="script.js"></script>
<script async type="text/javascript" src="script.js"></script>
Minify and Compress CSS/JavaScript: This will remove all the blank spaces and comments in the file. Smaller size means the files can load quickly, reducing the LCP time. We use https://www.minifier.org/ to do this. And for WordPress, we use WP-Rocket to address render blocking issues.
2. Reducing the Load time of LCP Resource
Serve Images in Next-Gen Formats: This means that you should better optimize/reduce the size of the images of LCP resource by converting them to next-gen format i.e. webp, which provides superior compression feature and best optimized for all the latest browsers compared to other formats.
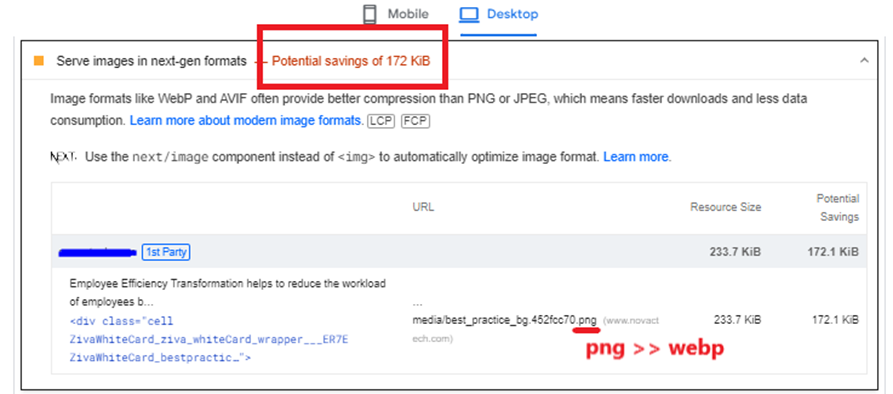
Potential Savings of Serving Images in Next-Gen Formats
You can see that resource’s size was too big. By converting it to webp, the size was reduced saving 172.1 KB. Meaning less time to load, and therefore reducing the LCP score.
To convert images to webp format, we used the <picture> tag:
<picture>
<source type="image/webp" srcset="/image.webp">
<source type="image/png" srcset="/image.png">
<img src="/image.png" alt=" " width="" height="" />
</picture>
The above syntax let browser to decide which image to load. For latest browsers, webp image will be loaded, and for older browsers, png will be loaded.
Serve Properly Size Images: The image shows that there are number of images that aren’t appropriately sized, along with the potential savings.
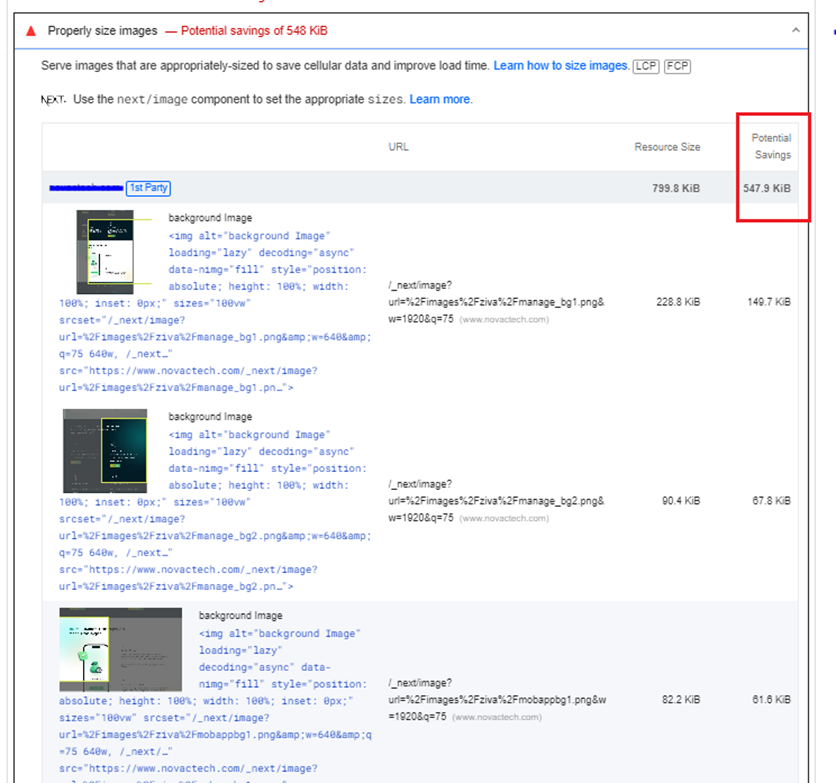
Potential Savings for Serving Properly Size Images
This recommendation implies that the page is serving the images in the LCP resource that are larger than rendered version, which directly affects the page load time.
To fix this issue, what we did was responsive image optimization. These responsive images let the browser choose the best-suited version of the image. It allows images with smaller dimensions to be downloaded for users on smaller devices. This way, the image loads faster, and the page will get a better LCP score. We generated multiple versions of each image, and then specified which version to use in HTML or CSS.
Since the web page was of html type, we had to manually optimize the images. This was a little complex process but we were able to so with the help of our tech experts. The whole idea here was to decrease the loading time of LCP image resources as much as possible without compromising the visual quality. For WordPress, WP-Rocket will do the trick.
Note: The more variants you specify, the more efficient the responsive image optimization would be. But make sure the images are being served in next-gen formats whenever it is supported by the user’s browser.
Some of the other ways to reduce load duration of LCP resource are:
Avoid Using Web Fonts Instead Use System Fonts: Most of the times, the LCP resource of a page will either be an image or web font. So along with optimizing images, it’s good to optimize web fonts by replacing with system fonts because, system fonts load faster, provide a familiar reading experience, and require less maintenance.
Use Content Delivery Network (CDN): A CDN network can help deliver your resources faster to users located in different parts of the world. That means you can host your assets on multiple servers across the globe, and you’re able to deliver content sooner to users anywhere in the world. Especially Image CDN in particular is very helpful because it not only reduce the distance the resource has to travel, but they also generally reduce the size of the resource.
Serve Critical Resources with cache-control Policy: Implementing cache-control policy on critical resources means when the users visit a page for the second time, the browser will serve those resources from the cache instead of downloading them each time, reducing the resource load duration to essentially zero.
A cache policy can be implemented for critical resources using cache-control headers. These headers tell the browser how long to cache a resource.
Cache-Control: max-age=31536000
//tells the browser to cache the resource for a year: 60 seconds × 60 minutes × 24 hours × 365 days = 31536000 seconds
3. Reducing the Resource Load Delay
The goal in this step is to ensure the LCP resource starts loading as early as possible. To reduce unnecessary resource load delay, consider preloading important resources. To avoid important resources (fonts, above-the-fold images or videos, and critical-path CSS or JavaScript) from being fetched last, prioritize them by using <link rel=”preload”>. To further improve your LCP score, use priority hints with the attribute fetchpriority="high" to prioritize the loading of the LCP image.
<!-- Load the stylesheet that will reference the LCP image. -->
<link type="text/css" rel="stylesheet" href="/path/to/styles.css " />
<!-- Preload the LCP image with a high fetchpriority so it starts loading with the stylesheet. -->
<link rel="preload" fetchpriority="high" as="image" href="/path/to/hero-image.webp" type="image/webp">
REMEMBER not to set loading=”lazy” on your LCP Element! While you should lazy load offscreen elements (below the fold) on your page, it’s not recommended to lazy load above-the-fold content like your LCP image in the interest of achieving a fast LCP timing.
4. Reducing Time to First Byte (TTFB)
Nothing can happen on the frontend (HTML, CSS, JavaScript) until the backend delivers that first byte of content. So, when optimizing LCP, it is very important to consider TTFB. The more you reduce TTFB, the faster will be your other load metrics.
Most of the times, the cause for high TTFB would be server relating. As we were not managing our client’s server directly, we requested their IT Team to have a check on the backend stacks and optimize them wherever necessary.
Optimizing Interaction to Next Paint (INP)
Fixing a bad INP takes time and lot of tech experts support, but it makes a direct way for better user experience. Since we are using PageSpeed Insights tool here, it is important to know that INP is a field metric and the tool requires real user interaction to make measurements. That means the lab data cannot report INP nor its Audit to find out the possible causes of poor INP.
To find slow interactions in the field, having just a field INP value is not enough, but you have to find out what interactions are causing a poor INP and why. This can be achieved by web-vitals JavaScript library. Once you have field INP data, you can then test those specific interactions manually in lab.
Our CrUX report showed just an INP value which was more than 100 ms. So, we had to manually find out the factors causing slow interactions. These were the issues we found and we fixed them accordingly:
- Some of the images were going out of screen and after page load its realigning and having horizontal scroll
- Scrolling was not happening and links in the page were not working till the page was getting loaded
- We found some images that were too much lazy loaded, because of which blank space was shown in the page
- JavaScript was taking long time to load
What if you don’t have field data? Whether or not you have field data, the next step is to manually test and reproduce slow interactions in the lab. But one of the methods you can try to find out what causing slow interactions when you don’t have field data would be using Total Blocking Time (TBT) metric. This metric correlate well with INP as it measures responsiveness during load. In our case, the TBT metric was already under control!
Here’s How We improved INP
Given that CSS and JavaScript codes are processed in the main thread, we believed that the above slow-response factors are due to heavy CSS and JS. Therefore, to make the page respond faster, we minimized the main thread work by optimizing CSS and JavaScript.
Minifying JS and CSS: Minification removes unnecessary characters like comments, whitespace, and formatting from JavaScript (JS) and Cascading Style Sheets (CSS) files. By doing so, we could able to reduce their file sizes without affecting functionality.
Smaller JS and CSS files download faster. This frees up the browser’s main thread to process user interactions quicker, leading to a smoother and more responsive experience.
Deferring Unused or Non-critical JavaScript: By deferring non-critical JavaScript, the browser can focus on processing user interactions first. This reduced the delay between a user’s action (like clicking a button) and the browser’s response, further reducing INP score.
Splitting Long JavaScript Tasks: By splitting long tasks into smaller ones, we were able to make the browser process user interactions even while the JavaScript code is running, which resulted in reducing the overall delay users experience when interacting with the page.
Reducing the Large DOM Sizes: The Document Object Model (DOM) represents the structure and content of a webpage. To improve the browser’s performance, we minimized the number of elements in the DOM or optimized how they were loaded. This reduced the time it was taking for the browser to react to user interactions.
Adjusted Lazy Loading for Off Screen Elements: While it is always recommended to lazy load offscreen images of your pages, too much lazy loading can again affect the performance. Sometimes, it creates blank spaces on the page initially. So, we adjusted the lazy loading implementation to be more targeted for non-critical resources, as too much lazy loading was creating.
CLS Also Matters!
While INP focuses on responsiveness to user actions, CLS can indirectly affect it. By addressing CLS, you ensure the layout remains stable while the page loads. This creates a more predictable user experience, where users can confidently interact with the page without worrying about unexpected layout jumps. This indirectly contributes to a better perception of responsiveness, potentially improving INP scores as well.
Mobile Data vs. Desktop Data
You can see the field and lab data for mobile and desktop separately in PageSpeed Insights Tool and Google Search Console. It’s quite common to see better CWV scores on desktops compared to mobiles. This makes sense because desktops typically have stronger hardware and more stable, high-speed internet connections. These factors contribute to a smoother user experience for tasks like content loading and responsiveness. And optimization process for both of these data is quite the same.
Tips to Reduce LCP and INP
- Avoid keeping images, videos, carousals and GIFS as your LCP resource as much as possible
- Get rid of the unnecessary third-party scripts
- Upgrade to a better web hosting service
Conclusion of the Case Study: Success Through LCP and INP Optimization
The case study presented in this article demonstrates the tangible benefits of optimizing Largest Contentful Paint (LCP) and Interaction to Next Paint (INP) for website success.
Potential Business Impact:
While the case study focused on technical optimizations, the positive impact on user experience has the potential to translate into real business benefits for our client. Here’s how:
- Increased Engagement: A faster and more responsive website can encourage users to stay longer, explore more content, and potentially convert into paying customers.
- Improved Search Ranking: Google’s emphasis on Core Web Vitals suggests that optimized LCP and INP scores may lead to better search engine rankings, increasing organic website traffic.
- Enhanced Brand Reputation: A positive first impression through a fast and responsive website can contribute to a stronger brand image and user trust.
This case study serves as a valuable example of how prioritizing Core Web Vitals, particularly LCP and INP, can significantly improve website performance and user experience. By implementing the optimization strategies outlined in this article, businesses can create a website that not only functions well but also fosters user engagement and contributes to overall success.
The future of Core Web Vitals is set to grow over time. If you are concerned with optimizing your site with the best, let’s talk.